Once the Goal Setup is complete and you click the Next icon, the Multi-Market Goal Worksheet displays.
The worksheet screen is divided into three sections.
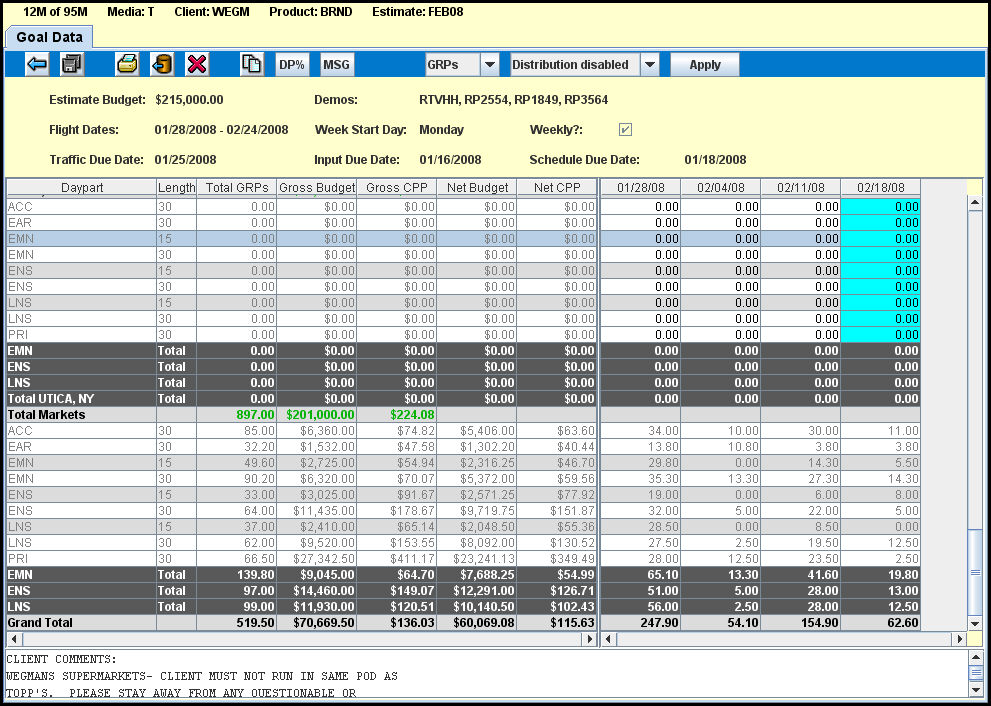
Left Section
The left section of the worksheet shows the totals where the planned Gross Budget, Total GRPs and Gross CPP columns display totals for each market's dayparts and spot lengths. Net Budget and Net CPP columns display net figures.
Budgeted GRPs and Budget Dollars that were entered on the previous screen appear in green. If goal dollars, GRPs or CPP entered on this screen exceed the numbers listed in green, they will display as red, warning you that they have exceeded their budget target.
Totals for each market as well as dayparts that contain multiple spot lengths are shaded using a dark gray color background.
Right Section
The right section of the worksheet shows each week or day (depending on the estimate) as a column. Choose a statistic type (GRPs, cost or CPP) to determine the statistic you wish to enter for each week or day. You may toggle back and forth to enter or view weekly/daily values for CPP, GRPs or cost.
The Multi-Market Goal Entry option employs a drag and drop copy feature, which enables you to copy values from one column or row to another. As values are entered, their totals adjust on the left side of the screen. A splitter bar is enables you to increase or decrease width size on either side; you may also drag and drop columns.
Hiatus weeks are shaded using a light blue color background.
Bottom Section
The Client Guidelines appear at the bottom of the worksheet. Use the scroll bar to view the text.
Across the top of the worksheet screen you'll find a series of icons and buttons that will allow you to perform related tasks.
Use the Back icon to close the worksheet and return to the startup screen
Use the Save icon to save the goals worksheet.
Use the Print icon to export the entire worksheet to a PDF file.
Use the Export icon ![]() to export the entire worksheet to spreadsheet file.
to export the entire worksheet to spreadsheet file.
Use the Clear icon ![]() to remove goals for selected or all rows.
to remove goals for selected or all rows.
Use the Copy icon ![]() to display the Copy Weeks dialog box, which allows you to copy goal information from one week/day to one or many weeks/days.
to display the Copy Weeks dialog box, which allows you to copy goal information from one week/day to one or many weeks/days.
Click the DP% button to display the Daypart Percent dialog box, which displays all dayparts/spot length combinations per each market.
Click the MSG button to display the Send Message dialog box, which allow you to send an Instant message to another Broadcast user.
Use the Statistics Type drop down to select one of the three available statistic types: GRPs, Cost, or CPP.
Use the Cost Distribution drop down to select one of the four available distribution types:.
Distribution Disabled – enables you to enter GRPs, cost and/or CPP values in each of the weekly/daily columns. Totals are automatically calculated and the totals columns are read only.
Budget Distribution – a method that enables you to enter GRPs per each week/day and enter a total dollar amount in the gross budget for each daypart/spot length combination. Dollars are then distributed evenly (Number of weeks/Gross Budget) regardless of the number of GRPs entered per week. CPP values are automatically calculated.
Budget % Distribution – similar to the Budget Distribution option, enables you to enter weekly/daily GRPs and a total daypart/spot length gross budget. Cost is calculated for each week/day by dividing weekly/daily GRPs by the total entered GRPs. The remaining ratio is applied to the weekly/daily cost.
CPP Distribution – You can enter a Gross CPP value as a constant value. When you enter weekly/daily GRPs, each weekly/daily cost will be calculated.
Click the <Apply> button to implement the changes you make to this window.