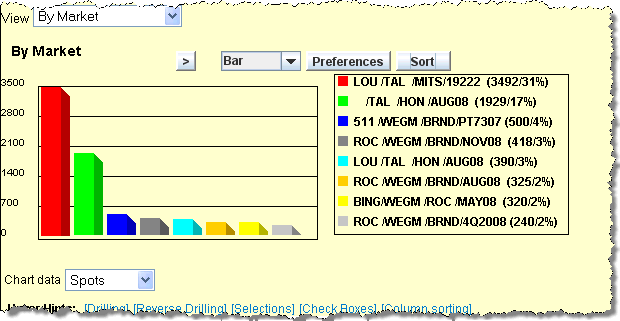
When you click the Graph icon on the Pivotal Buy Display Detail window, a Java applet launches and creates a graph of the data displays in the middle of the window. The legend to the right of the graph lists the number and percentage for each bar. To hide the graphical display, click the Hide Graph icon .
Pivotal Buy Display Graph Example
To change the bar graph to a pie chart, select Pie from the drop down list above the legend.
When a graph is displayed, select the type of data to be graphed from the Chart data drop down list below the graph.
To change the graphical data sort from alphabetical by code to descending order by amount, click the <Sort> button above the legend. To return to the alphabetical sort, click the Refresh icon. Note that you may not change the sort if the Sort preference is checked.
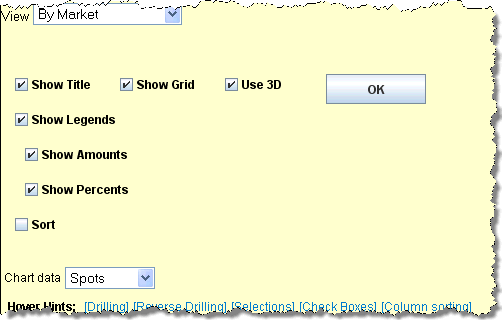
To select different preferences for the graph display, click the <Preferences> button above the graph legend to display the Graph Preferences section which temporarily replaces the graph. Select the preferences as explained below then click <OK> to save the preferences and redisplay the graph.
Show Title, Show Grid, Use 3D, Show Legends, Show Amounts, Show Percents. These preferences are selected (checked) by default. To omit any of these, click the check box to remove the check.
Sort. Defaults to unchecked. To always display the data in amount order, select this check box t. When unchecked, initially displays the data alphabetically by code; You may then click the <Sort> button above the legend on the graph display to switch to the amount sort and then click the Refresh icon to return to the alphabetical sort.